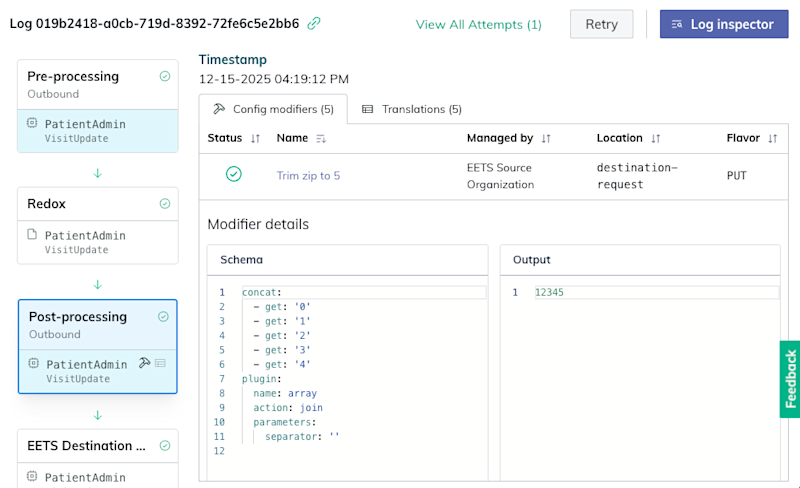
Logs show how data is processed (whether synchronously or asynchronously) and delivered via Redox.
A log is a step-by-step record of what data was exchanged, as well as how and when it was sent. This record is an aggregation of small transactional components with the request details and data payloads exchanged between you and your connection.
Logs are an essential tool for monitoring or debugging since they contain the what, when, and how of your data exchange. By using logs, you can:
- Confirm success: See when a message was successfully sent or received.
- Inspect payloads: View the exact payload data that was sent or received to verify its contents.
- Diagnose errors: Pinpoint where a failure occurred and view related error messages.
Redox creates a log for every attempted request. A couple of caveats:
- If a notification is automatically retried multiple times, one log is created with multiple attempt IDs.
- If one notification is sent to multiple destinations, a log is created for each destination the notification was sent to.
You can review log information on the Logs page of the Redox dashboard. Learn how to search for logs.
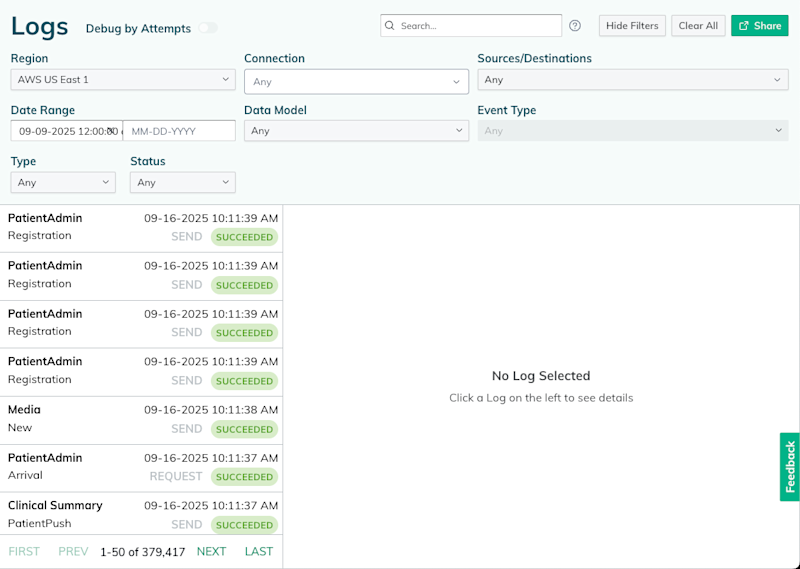
Redox sorts logs by timestamp with the most recent one at the top. Just note that if you’re new to Redox, there won’t be any logs to display until your organization starts using any of the developer tools to send test messages.
You can also retrieve log data via API with these Platform API endpoints:
When you open a log, you’re seeing the story of a single transaction. Generally, here’s how to read a log:
- Check the status: The first thing to look at is the overall log status (see log statuses). This gives you an immediate idea of the outcome.
- Review the details: The log details tell you who sent the data (i.e., source), who it was for (i.e., destination), and which data model was used.
- Trace the processing stages: The log stages show the journey of your data through Redox. This includes any data operations that were applied (e.g., filter, translation, config modifier).
- Inspect the payload: Use log inspector to view the actual data that was transmitted. This is critical for debugging issues with data format or content.
Let’s break down the log more specifically:
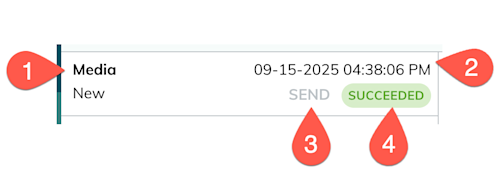
Log detail | Description | |
|---|---|---|
1 | Data model | The Redox data model, FHIR® resource, or FHIR® notification that data was converted to in order to facilitate data exchange. Review our available schemas: |
2 | Timestamp | The date and time that the log finished processing (i.e., reached a final state). Review log statuses below for definitions. |
3 | Log type | The type of log, which indicates which system originated the message and whether the exchange was asynchronous or synchronous. SEND: A source in your organization initiated the asynchronous notification to your connection. RECEIVE: A destination in your organization received the asynchronous notification from your connection. REQUEST: Your system initiated the synchronous query from a source in your organization. RESPOND: Your system responded to the synchronous query from a destination in your organization. Learn about handling notifications and handling queries. |
4 | Log status | The current or final state of the log. Review log statuses below for definitions. |
Every log has a distinct status that reflects its current or final state:
Status | Description |
|---|---|
SUCCEEDED | The request was successfully processed and delivered to the designated destination. |
FAILED | The request didn’t process correctly or couldn’t be delivered to the designated destination. In the case of a failed asynchronous notification to a production environment, this status could mean that retries are in progress or have been attempted but weren’t successful. Redox doesn’t automatically send notifications if a log fails. However, you can set up traffic alert rules to notify you when there are a certain number of failed logs. |
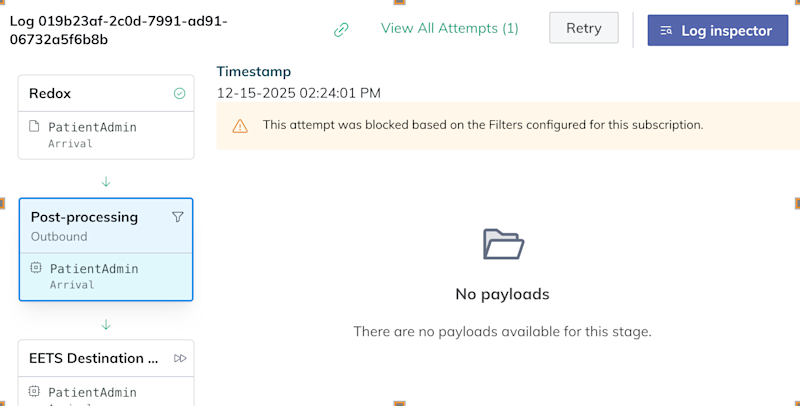
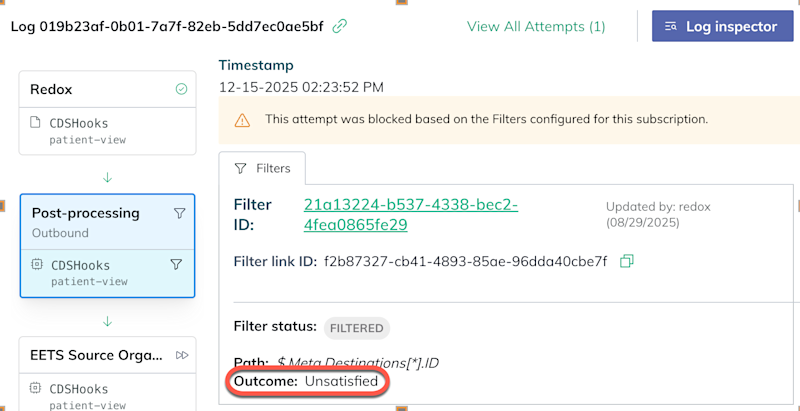
FILTERED | Redox filtered the data payload based on your filter settings for the related data model or FHIR® notification. Read about filters. |
PENDING | This is an interim state that means the request is queued for or currently processing. This status will result in one of the final states listed above. |
In the Redox dashboard, we provide a visual of how a log is processed in five- or nine-block stages, which represent high-level events of log processing. The number of blocks depends on the log type.
For async traffic, the log details show these five stages:
- Source
- Pre-processing
- Redox
- Post-processing
- Destination
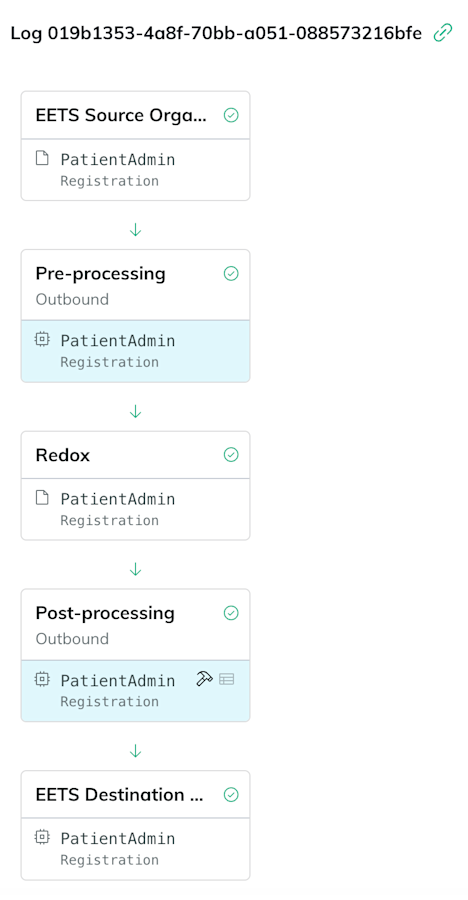
For sync traffic, the log details show these nine stages:
- Source
- Pre-processing (outbound)
- Redox
- Post-processing (outbound)
- Destination
- Pre-processing (inbound)
- Redox
- Post-processing (inbound)
- Source

Log stages give you an idea of how data passes from a source, through Redox, to a destination (and potentially back again). However, a more detailed view of log processing is conveyed through operations.
Operations are individual steps in log processing, where a payload is altered in some way (e.g., cleansed, tagged, translated, filtered). Learn about operations.
To summarize, operations are the way work gets done, while stages are how we bucket the work. Most importantly, stages show high-level events and don’t have a strong ordering of step-by-step events like operations.
Selecting a processing stage opens the log details, which includes any available:
- Metadata: A stage’s metadata could include timestamps, communication method, or source / destination names for that particular processing stage.
- Request, response, or data model payloads: A payload is a captured copy of the log at a specific point during processing. It’s often a JSON object. To view any payloads, users must have a support or engineer role in the environment. Learn about roles.
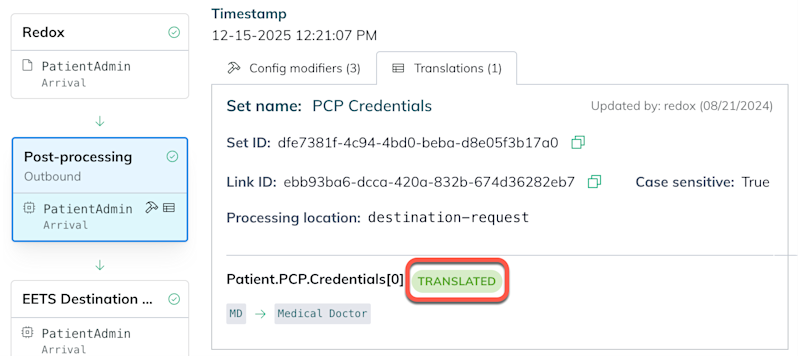
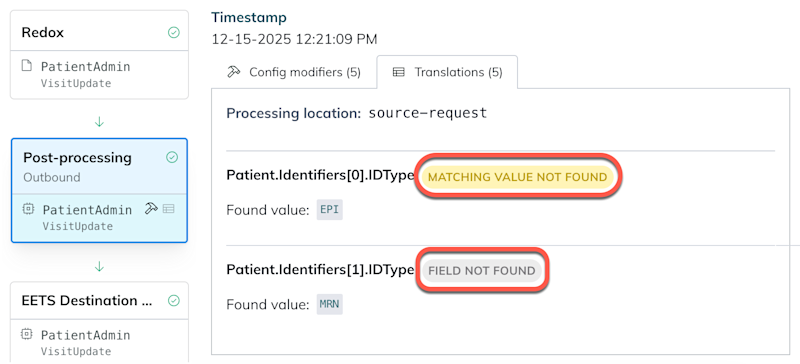
- Data operation(s): Any details about customer-managed operations, including filters, config modifiers, or translation sets. Data operation details are visible to any users in the environment. To edit a related operation, a user must have a support or engineer role.
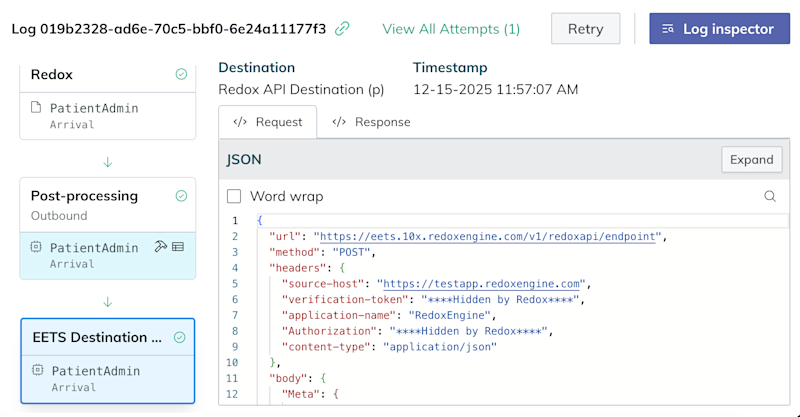
If a log processing stage has operations you manage linked to it (i.e., filters, translations, or config modifiers), there are icons for them. If an icon is grayed out, it means it didn’t take effect in this processing stage.
Selecting the processing stage allows you to see which customer-managed operations were applied to the log.
While log details show high-level processing, they’re limited to showing only what was delivered and when. Not every message delivers smoothly, though, and you might want to dig into the details of unexpected errors or unsuccessful deliveries / receipts.
Log inspector shows you operation details grouped by processing stage (read about operations). Not every log stage appears in log inspector, though; only stages where operations executed appear. This empowers you to do your own troubleshooting to find where or what might have gone wrong during log processing.
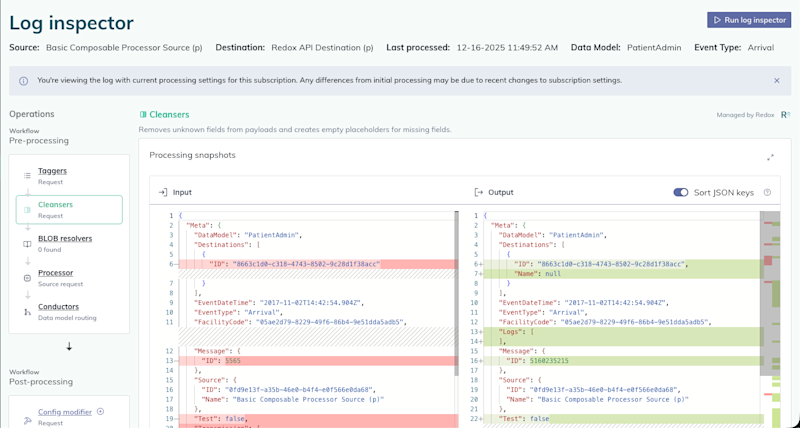
A user assigned to a support or engineer role can run the log inspector either in the Redox dashboard or with the Platform API. Running log inspector shows the processing snapshots at the input and output points of the operation and the result of each step. Most importantly, you can see whether the operation did nothing, succeeded, or failed.
Redox captures operations for all logs, not just the ones that you run log inspector on. However, extended payload snapshot data isn’t captured for logs outside of log inspector. Those extra details only result from running the log inspector.
