A Redox system alert is triggered when a production destination doesn’t receive expected data due to:
- VPN heartbeat failure (check VPN statuses)
- log failure
System alerts help you see where or how the issue happened. Learn about monitoring data exchange health.
Any user in an environment may view Redox system alerts for your organization or your connection.
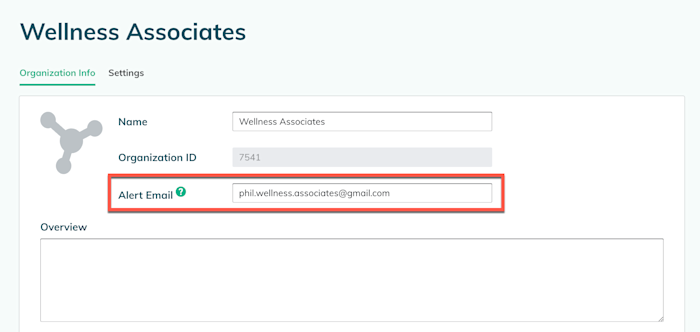
When a VPN or log fails and hinders production traffic, we send a notification to your Redox organization’s alert email address. To add or change this email address:
- Log in to the Redox dashboard.
- Your username displays at the bottom of the navigation menu. Click your username for the user menu to appear.
- From the user menu, select the Organization Profile option.
- Add or change the alert email address. You can only enter one email address in this field.
- Click the Submit button.

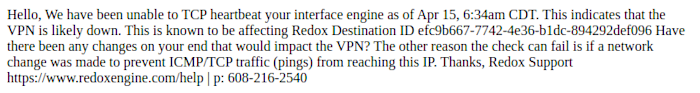
In the event of a triggered system alert, we send an email notification that looks something like this:

You can preemptively check triggered or historical system alerts on the Monitoring page of the Redox dashboard. We retain historical alerts up to 60 days. You can also see system alerts sent to your connection on this page.
To actively monitor your integration health, you can check a VPN status in real-time. Or, to dig into more details after reviewing a system alert, run log inspector.
- Log in to the Redox dashboard.
- From the navigation menu, click the Monitoring page.
- By default, the Alert Rules tab opens. Click the System Alerts tab. Any system alerts from the last 60 days display.Only for production environments
- (Optional) Use the filters at the top of the page to narrow down the list of system alerts. At any point, you can click the Clear All button to reset the filters to their defaults.
- Alerting organization: Set to Any by default. To filter by a particular organization, click the drop-down field and select the organization name. In the drop-down list, your organization appears first and your connections display below. You can only select one organization if using filters.
- Alert type: Set to Any by default. To filter by type, click the drop-down field and select either Log Failure (read about automatic retries) or VPN Heartbeat Failure (read about VPN tests and status definitions)
- Date range: Set to empty by default. To filter by timestamp (i.e., when the issue occurred), select a start date up to 60 days prior and an end date.
- Status: Set to Any by default. To filter by status, click the drop-down field and select either Resolved (the issue was fixed) or Triggered (the issue is active and ongoing).
![Use the system alert filters]()
Use the system alert filters
- Review details about any system alerts.
- Alerting organization: The name of the organization where the alert was triggered. This is the organization that should’ve received an email notification. The system alert type displays below the organization name.
- Related links: (Only for log failures) Links to logs or other related information for more details.
- Subscription: Links to the relevant traffic details based on the alert type. For a log failure, the link(s) open the subscription details. For VPN heartbeat failure, the link(s) open the production destination details.
- Error status: The current system alert status, which is either triggered (i.e., active alert) or resolved.
- Timestamp: The date/time that the system alert was triggered.


