Redox triggers alerts when a production endpoint, or destination, doesn't receive the expected patient data. You can easily view these alerts right in the Redox dashboard.
By checking an alert in the dashboard, you can find out where or how the issue happened within the integration. You can also see alerts sent to your connection's systems about their endpoints.
Of course, you can check your inbox if you opted in for email notifications about alerts. But the Monitoring page shows all your historical alerts so you don't have to worry about missing an email or digging through your inbox. Alternatively, you can view alerts as they happen in real-time by checking a VPN status.
Currently, we support viewing alerts for issues with a VPN heartbeat or log failure for up to 60 days in the past.
Follow these instructions to monitor alerts in a production environment.
- Log in to the Redox dashboard.
- From the navigation menu, click the Monitoring page.
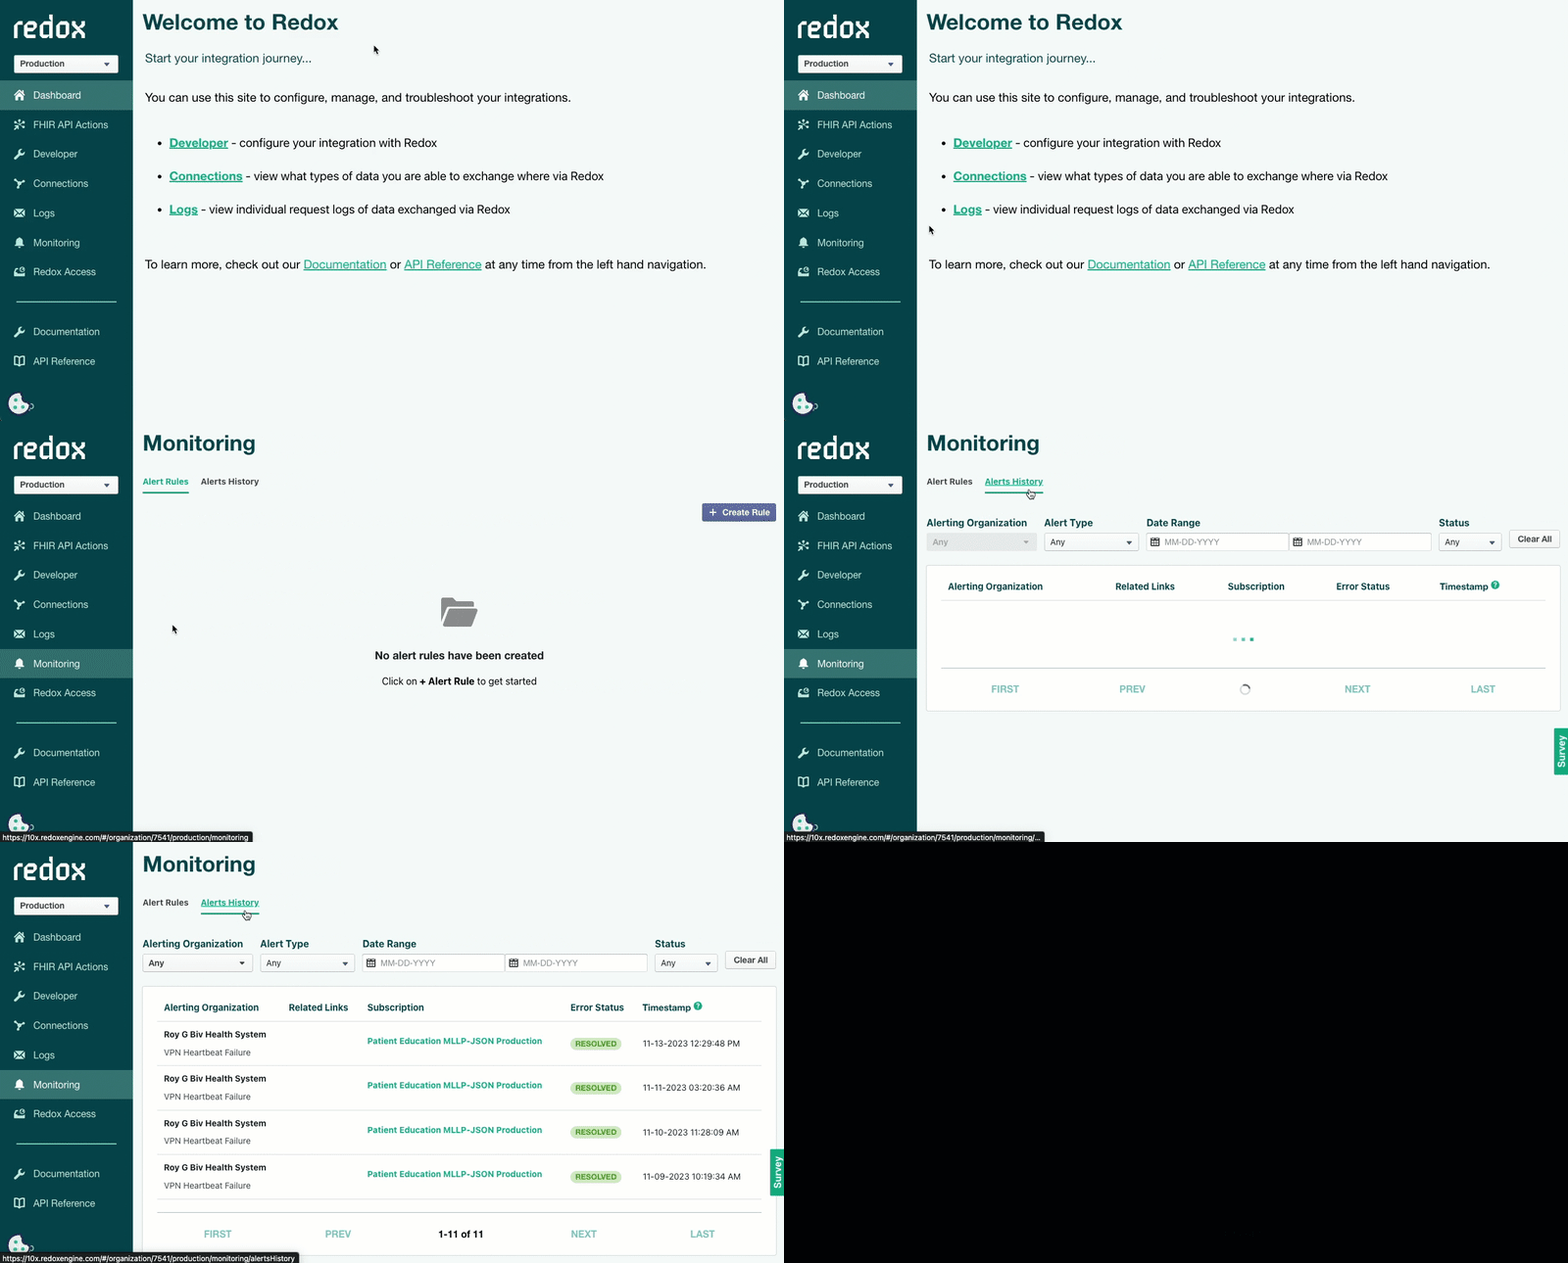
- By default, the Traffic Alert Rules tab opens and displays any configured alerts. Click the Alerts History tab.
- Any alerts from the last 60 days display.
![Navigate to the Alerts History tab]()
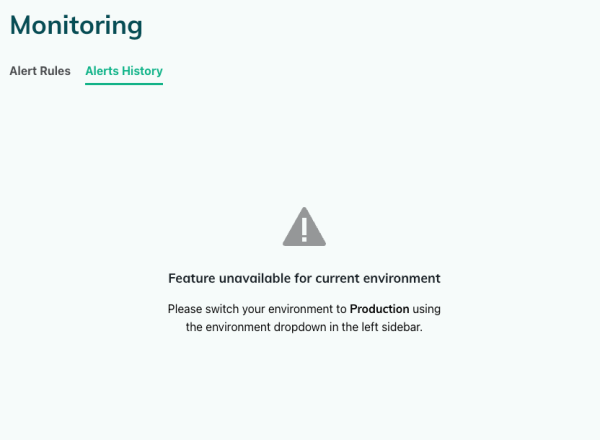
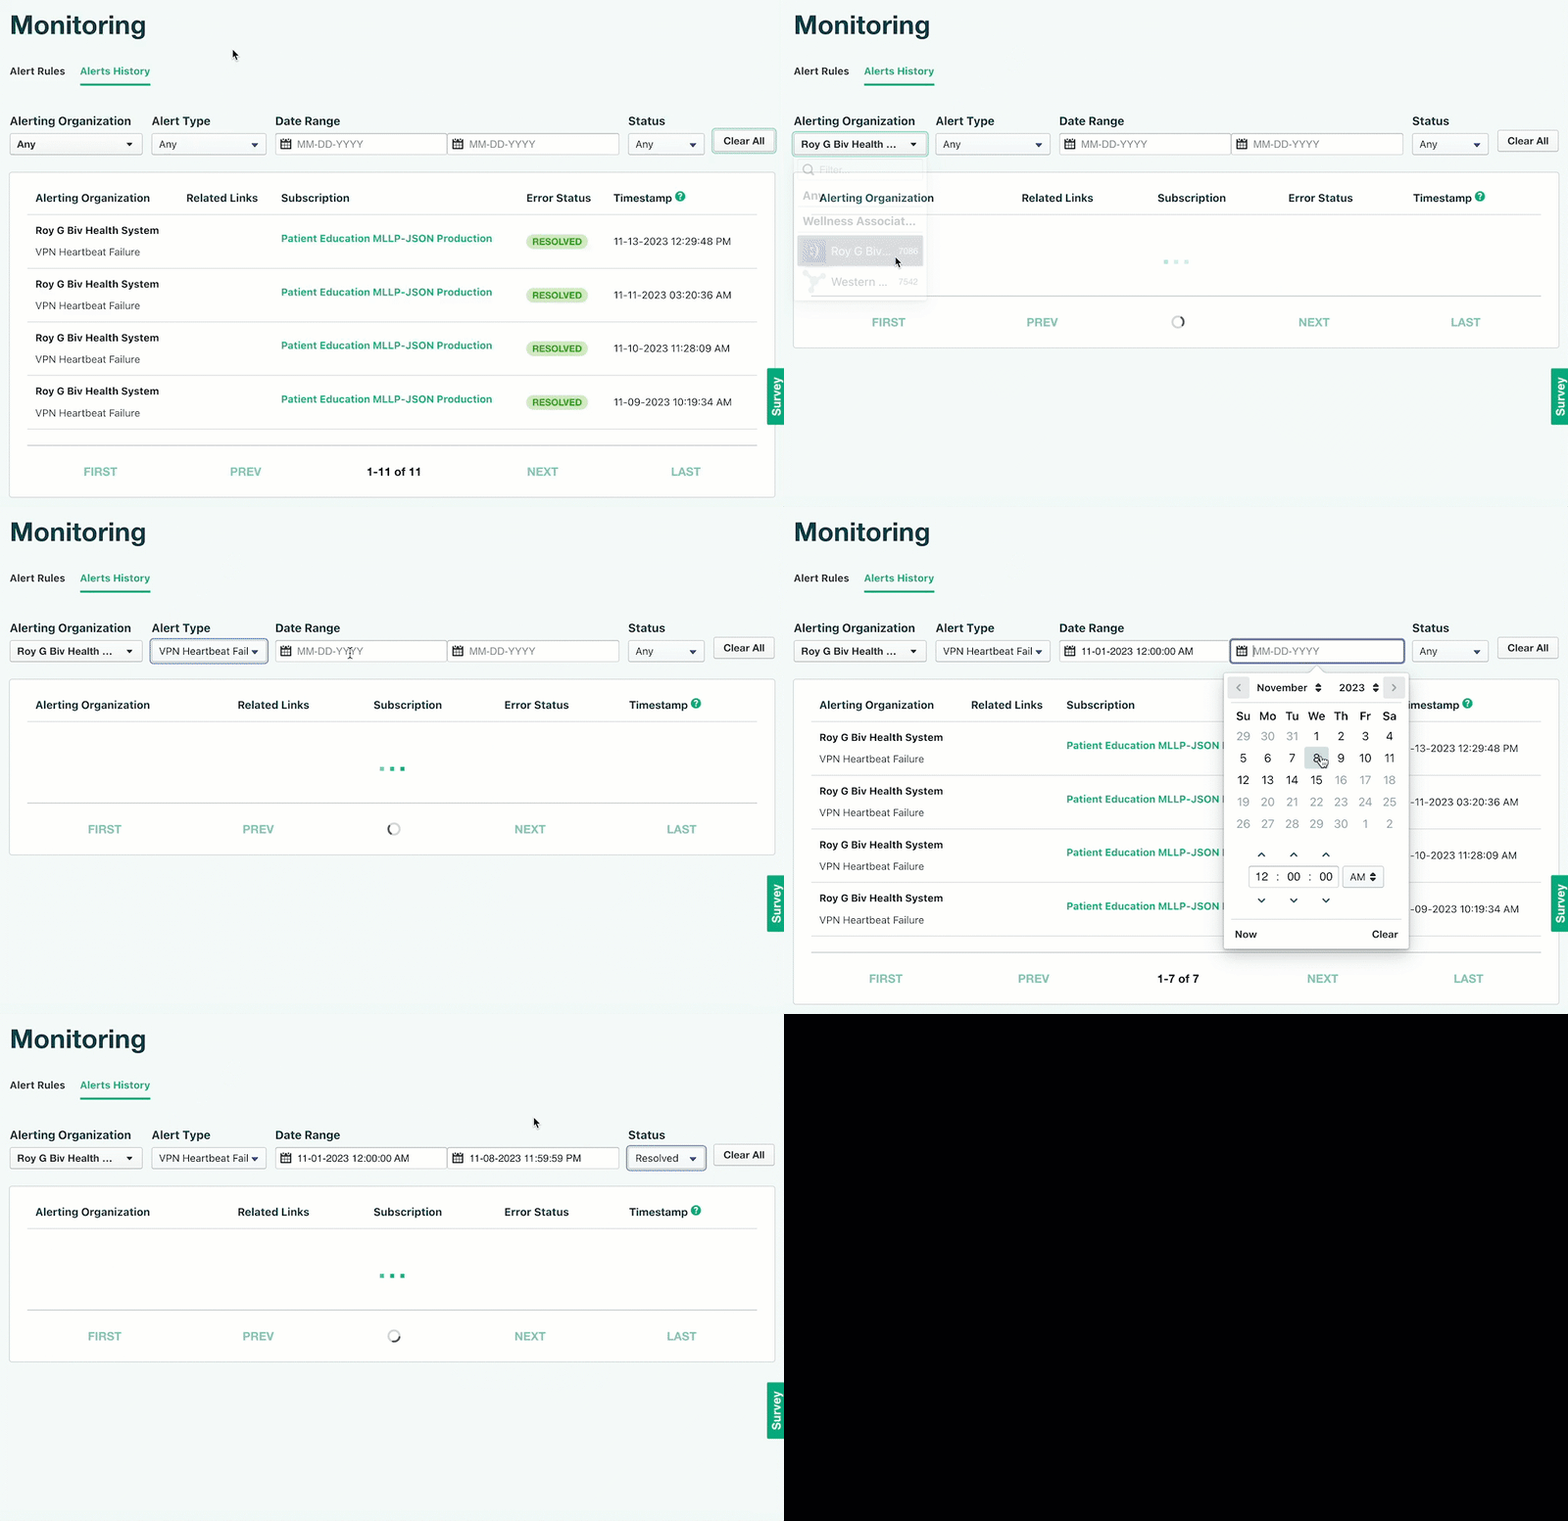
Navigate to the Alerts History tab Only for production environments - If you want to narrow down the displayed alerts, use the filters at the top of the page. At any point, you can click the Clear All button to reset the filters to their defaults.
- Alerting organization: Set to Any by default. To filter alerts for a particular organization, click the drop-down field and select the organization name. In the drop-down list, your organization appears as the first option and any organizations you're connected to display below. You can only select one organization if you're using filters.
- Alert type: Set to Any by default. To filter by alert type, click the drop-down field and select either Log Failure (read about message failures and retries) or VPN Heartbeat Failure (read about VPN tests and status definitions)
- Date range: Set to empty by default. To filter by the timestamp that the alert was triggered (i.e., when the issue occurred), select a start date up to 60 days prior and an end date.
- Status: Set to Any by default. To filter by alert status, click the drop-down field and select either Resolved (the issue was fixed) or Triggered (the issue is active and ongoing).
![Alerts filters]()
Alerts filters
- The filtered alerts display with their details.
- Alerting organization: The name of the organization where the alert was triggered. This is the organization that should've received the alert notification via email. The alert type displays below the organization name.
- Related links: Links to logs or other related information for more details. Currently, links are only provided for log failures.
- Subscription: Links to the relevant traffic details based on the alert type. Log Failure links take you to the subscription details. VPN Heartbeat Failure links take you to the related endpoint details.
- Error status: The current alert status, which is either triggered (active alert) or resolved.
- Timestamp: The date/time that the alert triggered.


