The Redox dashboard makes it easy to view successful, failed, or pending traffic for the last 60 days. You can search for a specific log or use the log filters to narrow down the list of displayed logs.
This article contains instructions for searching for logs in the Redox dashboard. If you'd like to search via API instead, use these Platform API endpoints:
Keep in mind that you can while you can search log metadata or payloads via API, you won't receive log payloads in the responses. You can only review log payload contents in the Redox dashboard (if you're assigned to an engineer or support role).
- Log in to the Redox dashboard.
- From the navigation menu, click the Logs page.
- By default, the logs search bar and filters display, along with any logs for the last 7 days. Use search terms, filters, or a combination of both to search for logs.Only for engineer or support roles
Any user in a given environment may view and search log metadata. However, you must be assigned to an engineer or support role to search log payloads with confidential data, retry a log, or run log inspector. Learn about roles.
- For search filters, select options from any of these drop-down fields:
- Connection
- Sources / destinations
- Date range
- You may set the start date, end date, or both.
- Data model
- Event type
- This filter is only enabled if you select a data model or FHIR® resource/notification from the Data model filter.
- Type
- StatusExtra search filters
Depending on the setup of your Redox organization, you may see extra log filters.
- Multi-region organizations have a Region filter with options for your relevant cloud provider region.
- Organizations with backfill data have a Database filter for searching historical or production logs.
- For search terms, review our searchable fields at the end of this article. Then, enter any of these values into the search bar based on the supported searchable fields:
- metadata identifiers (This is the only search term option available to users assigned to observer roles.)
- patient ID or namePatient name tips
Patient name must be in one of these formats:
- FirstName LastName
- LastName
For FHIR® logs, though, you can only search by patient name for these FHIR® resources:
- Patient
- Practitioner
No fuzzy matchingLog searches are case-insensitive but use exact terms. In other words, we don’t support fuzzy matching, and we don’t correct typos in a search string. If you type “Jane Gibons” but meant to search for “Jane Gibbons”, we don’t assume, so we strictly search for and return results for “Jane Gibons.”
- provider ID
- visit number or ID
- record (i.e., any other ID value specific to a data model)
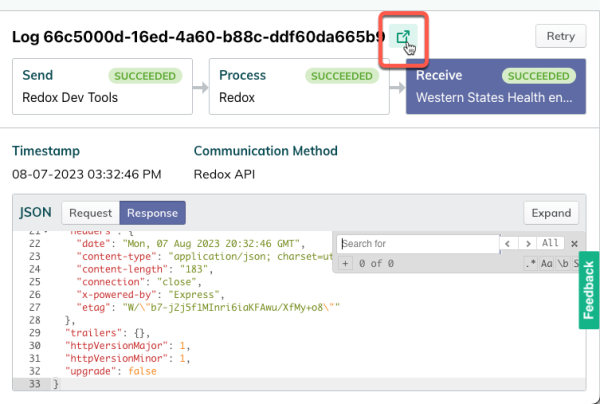
- After entering search criteria, the list of search results display on the left side of the page. Each log entry shows the status of the log. Learn about log statuses.
- Click on any of the results to view the log details. A visual flow of the data displays on the right. Click any part of the data exchange to view the details or the payload (if applicable).

![Log details]()
Log details Operation details in logsIf a log has undergone filtering or translation, you can view the related operation details when you click the related processing stage.
Learn about data operations and:
- log details for config modifiers (beta feature)
- If you want to share a particular log with a friend, you can do so by clicking the share link to the right of the log ID.

![Share a log]()
Share a log
Previously, we used the terms message and transmission. For posterity's sake, here are the those definitions:
- A message was the request sent by the source system to Redox.
- A transmission was the request received by the destination system via Redox.
Logs replace the concepts of messages and transmissions by combining them. Each log is a unique combination of a message and a transmission. Resubmitted transmissions are analogous to log attempts.
We support searching for terms in specific fields for a given data model or FHIR® resource / notification. That means if you try to search for a keyword that would exist in a different field than one listed below, we won’t return any matching logs.
Review searchable fields by data model type.
Category | Searchable fields |
|---|---|
Patient | Patient.Identifiers[*].ID Batch[*].Patient.Identifiers[*].ID Patient.Demographics.FirstName Patient.Demographics.LastName Batch[*].Patient.Demographics.FirstName Batch[*].Patient.Demographics.LastName |
Provider | Claims[*].Providers[*].ID BillingProvider.ID Batch[*].Claims[*].Providers[*].ID Batch[*].BillingProvider.ID |
Record | Transaction.ID Subscriber.ID Claims[*].ID Claims[*].ReferenceNumbers[*].ID Batch[*].Transaction.ID Batch[*].Subscriber.ID Batch[*].Claims[*].ID Batch[*].Claims[*].ReferenceNumbers[*].ID |
Visit | Claims[*].Visit.Number Batch[*].Claims[*].Visit.VisitNumber Claims[*].Visit.Location.Facility Claims[*].Visit.Location.Department |
Category | Searchable fields |
|---|---|
Patient | Patient.Identifiers[*].ID Header.Patient.Identifiers[*].ID Header.Patient.Demographics.FirstName Header.Patient.Demographics.LastName |
Provider | Header.Document.Author.ID Header.PCP.ID Documents[*].Author.ID |
Record | Header.Document.ID Documents[*].ID Document.ID |
Visit | Header.Document.Visit.VisitNumber Header.Document.Visit.Location.Facility Header.Document.Visit.Location.Department Visit.VisitNumber Documents[*].Visit.ID |
Category | Searchable fields |
|---|---|
Patient | Patient.Identifiers[*].ID Patient.Demographics.FirstName Patient.Demographics.LastName |
Provider | Visit.AttendingProvider.ID Visit.ReferringProvider.ID Visit.ConsultingProvider.ID Visit.Procedures[*].Performers[*].ID Transactions[*].Performers[*].ID Transactions[*].OrderingProviders[*].ID Procedures[*].Performers[*].ID Visit.AttendingProvider.FirstName Visit.AttendingProvider.LastName Transactions[*].Performers[*].FirstName Transactions[*].Performers[*].LastName |
Record | Transactions[*].ID Transactions[*].Department.Code Transactions[*].OrderID |
Visit | Visit.VisitNumber Visit.Location.Facility Visit.Location.Department |
Category | Searchable fields |
|---|---|
Patient | Patient.Identifiers[*].ID Patients[*].Identifiers[*].ID Media[*].Patient.Identifiers[*].ID Patient.Demographics.FirstName Patient.Demographics.LastName Patients[*].Demographics.FirstName Patients[*].Demographics.LastName |
Provider | Media.Provider.ID Media.Authenticator.ID Media.Provider.FirstName Media.Provider.LastName |
Record | DocumentIDs[*] Media.DocumentID Media.OriginalDocumentID Media.Notifications[*].ID Media[*].DocumentID |
Visit | Visit.VisitNumber VisitNumbers[*] Media[*].Visit.VisitNumber Visit.Location.Facility Visit.Location.Department |
Category | Searchable fields |
|---|---|
Patient | Patient.Identifiers[*].ID Patient.Demographics.FirstName Patient.Demographics.LastName |
Provider | Visit.AttendingProvider.ID Visit.ReferringProvider.ID Order.Provider.ID Order.Provider.NPI Order.EnteredBy.ID Order.VerifiedBy.ID Administrations[*].AdministeringProvider.NPI Administrations[*].AdministeringProvider.ID Administrations[*].OrderedBy.ID Administrations[*].VerifiedBy.ID Visit.AttendingProvider.FirstName Visit.AttendingProvider.LastName Order.Provider.FirstName Order.Provider.LastName |
Record | Order.ID Administrations[*].Medication.Order.ID |
Visit | Visit.VisitNumber Visit.Location.Facility Visit.Location.Department |
Category | Searchable fields |
|---|---|
Patient | Patient.Identifiers[*].ID Patients[*].Identifiers[*].ID Notes[*].Patient.Identifiers[*].ID Patient.Demographics.FirstName Patient.Demographics.LastName Patients[*].Demographics.FirstName Patients[*].Demographics.LastName |
Provider | Note.Provider.ID Note.Authenticator.ID Note.Provider.FirstName Note.Provider.LastName |
Record | DocumentIDs[*] Orders[*].ID Note.DocumentID Note.OriginalDocumentID Note.Notifications[*].ID Notes[*].DocumentID |
Visit | Visit.VisitNumber VistNumbers[*] Notes[*].Visit.VisitNumber Visit.Location.Facility Visit.Location.Department |
Category | Searchable fields |
|---|---|
Patient | Patient.Identifiers[*].ID Patients[*].Identifiers[*].ID Orders[*].Patient.Identifiers[*].ID Patient.Demographics.FirstName Patient.Demographics.LastName Patients[*].Demographics.FirstName Patients[*].Demographics.LastName |
Provider | Order.Provider.ID Order.Provider.NPI Orders[*].Provider.NPI Orders[*].Provider.ID Visit.AttendingProvider.ID Visit.ReferringProvider.ID Visit.ConsultingProvider.ID Order.Provider.FirstName Order.Provider.LastName Orders[*].Provider.FirstName Orders[*].Provider.LastName Visit.AttendingProvider.FirstName Visit.AttendingProvider.LastName |
Record | Order.ID Order.Procedure.Code Order.ApplicationOrderID Orders[*].ID Orders[*].ApplicationOrderID Orders[*].Procedure.Code OrderIDs[*] |
Visit | Visit.VisitNumber VistNumbers[*] Orders[*].Visit.VisitNumber Visit.Location.Facility Visit.Location.Department |
Category | Searchable fields |
|---|---|
Patient | Patient.Identifiers[*].ID Patients[*].Identifiers[*].ID Patient.Demographics.FirstName Patient.Demographics.LastName Patients[*].Demographics.FirstName Patients[*].Demographics.LastName |
Provider | Patient.PCP.NPI Patient.PCP.ID Visit.AdmittingProvider.ID Visit.AttendingProvider.ID Visit.ReferringProvider.ID Visit.ConsultingProvider.ID Visit.AttendingProvider.FirstName Visit.AttendingProvider.LastName |
Visit | Patients[*].Visits[*].VisitNumber Patients[*].Visits[*].Location.Facility Patients[*].Visits[*].Location.Department Visit.VisitNumber VisitNumbers[*] Visit.Location.Facility Visit.Location.Department |
Category | Searchable fields |
|---|---|
Patient | Patient.Identifiers[*].ID Patients[*].Identifiers[*].ID Patient.Demographics.FirstName Patient.Demographics.LastName |
Provider | Visit.AttendingProvider.ID Visit.ReferringProvider.ID Visit.ConsultingProvider.ID Visit.AttendingProvider.FirstName Visit.AttendingProvider.LastName |
Record | Education[*].InstanceID |
Visit | Visit.VisitNumber Visit.Location.Facility Visit.Location.Department |
Category | Searchable fields |
|---|---|
Patient | Patient.Identifiers[*].ID Patient.Demographics.FirstName Patient.Demographics.LastName |
Provider | Referrals[*].Providers[*].ID Referrals[*].Providers[*].FirstName Referrals[*].Providers[*].LastName Referral.Providers[*].ID Referral.Providers[*].FirstName Referral.Providers[*].LastName |
Record | Referral.ID Referral.Authorization.Number Referrals[*].ID Referrals[*].Authorization.Number |
Visit | Visit.VisitNumber Referral.Visit.VisitNumber Referrals[*].Visit.VisitNumber |
Category | Searchable fields |
|---|---|
Patient | Patient.Identifiers[*].ID Patients[*].Identifiers[*].ID Orders[*].Patient.Identifiers[*].ID Patient.Demographics.FirstName Patient.Demographics.LastName Patients[*].Demographics.FirstName Patients[*].Demographics.LastName |
Provider | Visit.AttendingProvider.ID Visit.AttendingProvider.FirstName Visit.AttendingProvider.LastName Visit.ReferringProvider.ID Orders[*].Provider.ID Orders[*].Provider.NPI Orders[*].Results[*].PrimaryResultsInterpreter.ID Orders[*].Results[*].PrimaryResultsInterpreter.NPI Orders[*].Results[*].Producer.ID Orders[*].Results[*].Performer.ID Orders[*].ResultCopyProviders[*].ID Orders[*].Provider.FirstName Orders[*].Provider.LastName |
Record | Orders[*].ID OrderIDs[*] Procedures[*].Code Orders[*].Procedure.Code |
Visit | Visit.VisitNumber Orders[*].Visit.VisitNumber Visit.Location.Facility Visit.Location.Department |
Category | Searchable fields |
|---|---|
Patient | Patient.Identifiers[*].ID Visit.Patients[*].Identifiers[*].ID Visits[*].Patient.Identifiers[*].ID Visits[*].Patient.Demographics.FirstName Visits[*].Patient.Demographics.LastName Patient.Demographics.FirstName Patient.Demographics.LastName Patients[*].Demographics.FirstName Patients[*].Demographics.LastName |
Provider | Visit.AttendingProvider.ID Visit.AttendingProvider.FirstName Visit.AttendingProvider.LastName Visit.ReferringProvider.ID Visit.ConsultingProvider.ID Visit.VisitProvider.ID Visit.VisitProvider.FirstName Visit.VisitProvider.LastName Visit.AttendingProviders[*].ID Visit.AttendingProviders[*].FirstName Visit.AttendingProviders[*].LastName Visits[*].AttendingProvider.ID Visits[*].AttendingProvider.FirstName Visits[*].AttendingProvider.LastName Visits[*].ConsultingProvider.ID Visits[*].ReferringProvider.ID Visits[*].VisitProvider.ID Visits[*].VisitProvider.FirstName Visits[*].VisitProvider.LastName Slots[*].Provider.ID AvailableSlots[*].Provider.ID |
Record | Slots[*].ID AvailableSlots[*].ID |
Visit | Visit.VisitNumber Visit.Location.Facility Visit.Location.Department Visit.Locations[*].Facility Visit.Locations[*].Department Visits[*].VisitNumber Visits[*].Location.Facility Visits[*].Location.Department |
Category | Searchable fields |
|---|---|
Patient | Patient.Identifiers[*].ID Patient.Demographics.FirstName Patient.Demographics.LastName |
Provider | Visit.AttendingProvider.ID Visit.AttendingProvider.FirstName Visit.AttendingProvider.LastName SurgeryStaff[*].ID |
Record | Procedures[*].Code SurgicalCase.Number |
Visit | Visit.VisitNumber Visit.Location.Facility Visit.Location.Department |
Category | Searchable fields |
|---|---|
Patient | Patient.Identifiers[*].ID PotentialMatches[*].Identifiers[*].ID Patient.Demographics.FirstName Patient.Demographics.LastName PotentialMatches[*].Demographics.FirstName PotentialMatches[*].Demographics.LastName |
Provider | Patient.PCP.NPI Patient.PCP.ID Vaccinations[*].Provider.ID Vaccinations[*].Order.Provider.ID Vaccinations[*].Order.Provider.NPI PotentialMatches[*].PCP.NPI PotentialMatches[*].PCP.ID |
Record | Vaccinations[*].Order.ID |
Visit | Visit.VisitNumber |
Review the list of supported searchable fields by FHIR® resource type. Keep in mind that only some FHIR® interactions or operations are searchable. Learn about FHIR® interactions and operations.
You can search these fields for specific interactions or operations (see table below):
- request.identifier[].value
- identifier[].value
You can search supported fields in these operation types:
Operation | Log type | Searchable fields |
|---|---|---|
$payment | REQUEST | request.identifier[].value |
$respond | REQUEST | request.identifier[].value |
$status-response | REQUEST | identifier[].value |
You can search these fields:
- identifier[].value
- code.coding[].code
You can search supported fields in these interaction or operation types:
Interaction or operation | Log type |
|---|---|
read | RESPONSE |
search | RESPONSE |
$write | REQUEST |
You can search supported fields in any FHIR® notifications.
You can search this field:
- identifiers[].value
You can search supported fields in these interaction or operation types:
Interaction or operation | Log type |
|---|---|
read | RESPONSE |
search | RESPONSE |
$write | REQUEST |
You can search supported fields in these FHIR® event notifications types:
Notification | Log type |
|---|---|
All PatientAdmin notifications | REQUEST |
You can search these fields:
- type.coding[].code
- name
You can search supported fields in these interaction or operation types:
Interaction | Log type |
|---|---|
read | RESPONSE |
You can search supported fields in these FHIR® event notifications types:
Notification | Log type |
|---|---|
All PatientAdmin notifications | REQUEST |
You can search these fields:
- identifiers[].value
- name[].given
- name[].family
You can search supported fields in these interaction or operation types:
Interaction or operation | Log type |
|---|---|
read | RESPONSE |
search | RESPONSE |
$write | REQUEST |
$match | RESPONSE |
You can search supported fields in any FHIR® notifications.
You can search these fields:
- identifiers[].value
- name[].given
- name[].family
You can search supported fields in these interaction or operation types:
Interaction | Log type |
|---|---|
read | RESPONSE |
search | RESPONSE |
You can search supported fields in these FHIR® event notifications types:
Notification | Log type |
|---|---|
All PatientAdmin notifications | REQUEST |
FHIR® is a registered trademark of Health Level Seven International (HL7) and is used with the permission of HL7. Use of this trademark does not constitute an endorsement of products/services by HL7®.